A more realistic system includes a mechanism to dissipate mechanical energy from the system (very often as heat). A damped simple harmonic oscillator is shown schematically in Figure 3. A rigidly connected damper is expressed mathematically by adding a damping term proportional to the velocity of the mass to the differential equation describing the motion. Similar to the undamped system, an external force results in a displacement amplitude of the spring, which is related to the mass displacement by the transmissibility. Plots of
T versus ω are shown in Figure 3 for various values of the damping coefficient (ξ). When ξ approaches zero, the curve becomes exactly the same as for the undamped system. However, as the damping increases, the amplitude at resonance decreases and the "roll-off" at higher frequencies decreases, i.e., the transmissibility declines more slowly as damping increases. It is the reduction in amplitude at resonance that explains why the use of damping is a key strategy in both the design of optical tables as well as isolators (see
Vibration Control Systems).
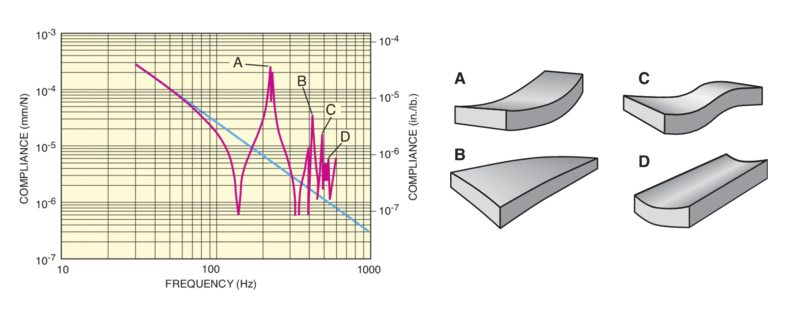
While the discussion of a rigidly connected mass-spring system is informative, no actual structure is a perfectly rigid body. All structures vibrate by flexing and twisting. The response of structures to random vibrations can be quite complicated because they vibrate with complex deformations and have more than one resonant frequency. The resonant frequencies of an object are the natural frequencies of vibration determined by the physical parameters of the vibrating object. The compliance curve, the classic method of measuring dynamic rigidity, is a useful tool for evaluating the basic dynamics of a vibrating structure. Compliance is a measure of the susceptibility of a structure to move as a result of an external force. The greater the compliance, i.e., the lower the stiffness, the more easily the structure moves as a result of an applied force, e.g., vibration. Compliance curves show the displacement amplitude of a point on a body per unit force applied (
C = |x| / |
F|), as a function of frequency. The units of compliance are typically given in mm/N or in/lb. The dynamic performance of a table top is usually characterized with a compliance curve, a log-log plot of the table's dynamic response to random vibration (see Figure 4). The compliance of a rigid body is proportional to 1/ω
2 and is graphed as a straight line with slope of -2. This line, which is called the ideal rigid body (IRB) line, represents the dynamic performance of a theoretically perfect rigid table. For non-rigid bodies, a compliance curve shows the structure's resonant frequencies and its maximum amplification at resonance.


